




TPRMThird-Party Risk Management
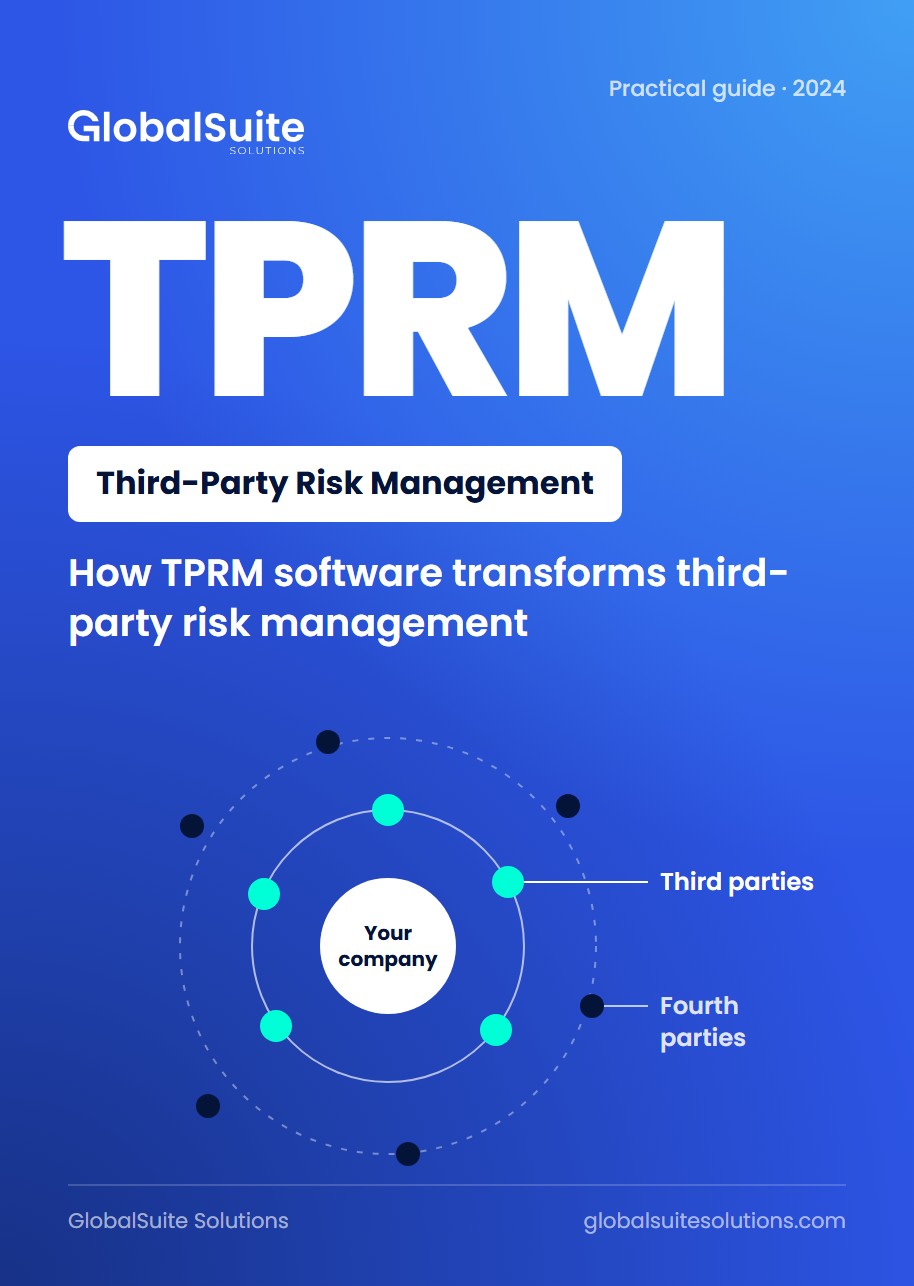
How a TPRM Software Can Transform Third-Party Risk Management
How to identify, assess and mitigate partner and supplier risk with software.
Download the guidePlatform
All-in-one GRC platform
AI built into every module
The common engine behind every module
GRC tailored to your industry
Connect GlobalSuite® to your tools
Standards and frameworks
ISO standards
Regulations
Document once, comply with all.
Resources
 Success storyEMT Madrid centralises its data protection management in GlobalSuite®Read the story
 G2 reviewsWhat the people who use GlobalSuite® every day say about itRead reviewsA customer? Leave a review
Popular searches
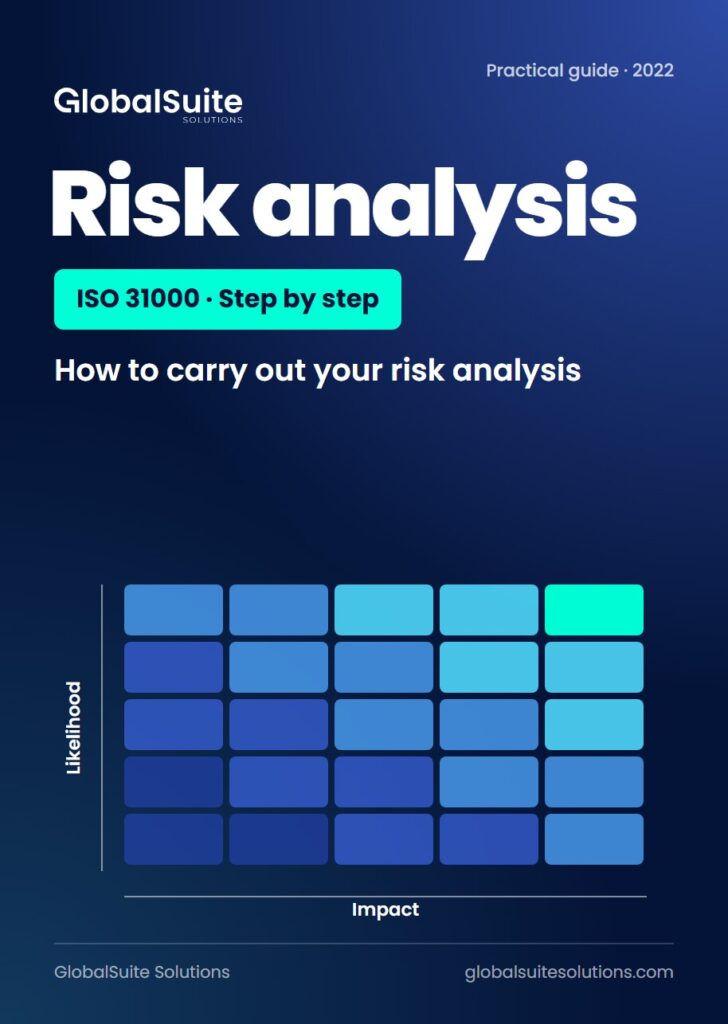
Practical guide · 2022
ISO 31000 · Step by stepA step-by-step methodology to inventory your assets, assess risks and controls and present the results to senior management.
Download the free guideA risk assessment starts with knowing what you are going to assess and ends with a report senior management can understand. In between, you identify the risks, rate them and measure how much your controls reduce them.
This practical guide is an extract of the GlobalSuite Solutions methodology that many customers already use. It is written for risk managers who want to bring order to their assessments, and it is told by a consultant working through a real case: the Financial Management process in their organisation.
Each section opens with the questions worth asking and ends with a challenge for your own company. First you draw the dependency tree, then you list risks and rate them from 1 to 5 for likelihood and impact, and finally you score how effective your controls are.
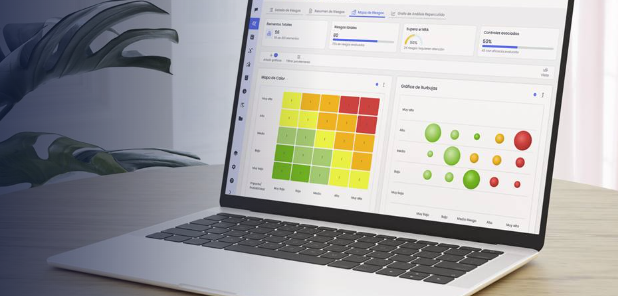
The example is worked through in GlobalSuite®. The Inventory gathers the elements and arranges them in the dependency tree, and the interactive table filters which processes have risks above the moderate level. The "Element Risks" and "Risks vs. Acceptable Risk Level" charts used in the presentation come straight from the tool.
How to identify, assess and mitigate partner and supplier risk with software.
Download the guide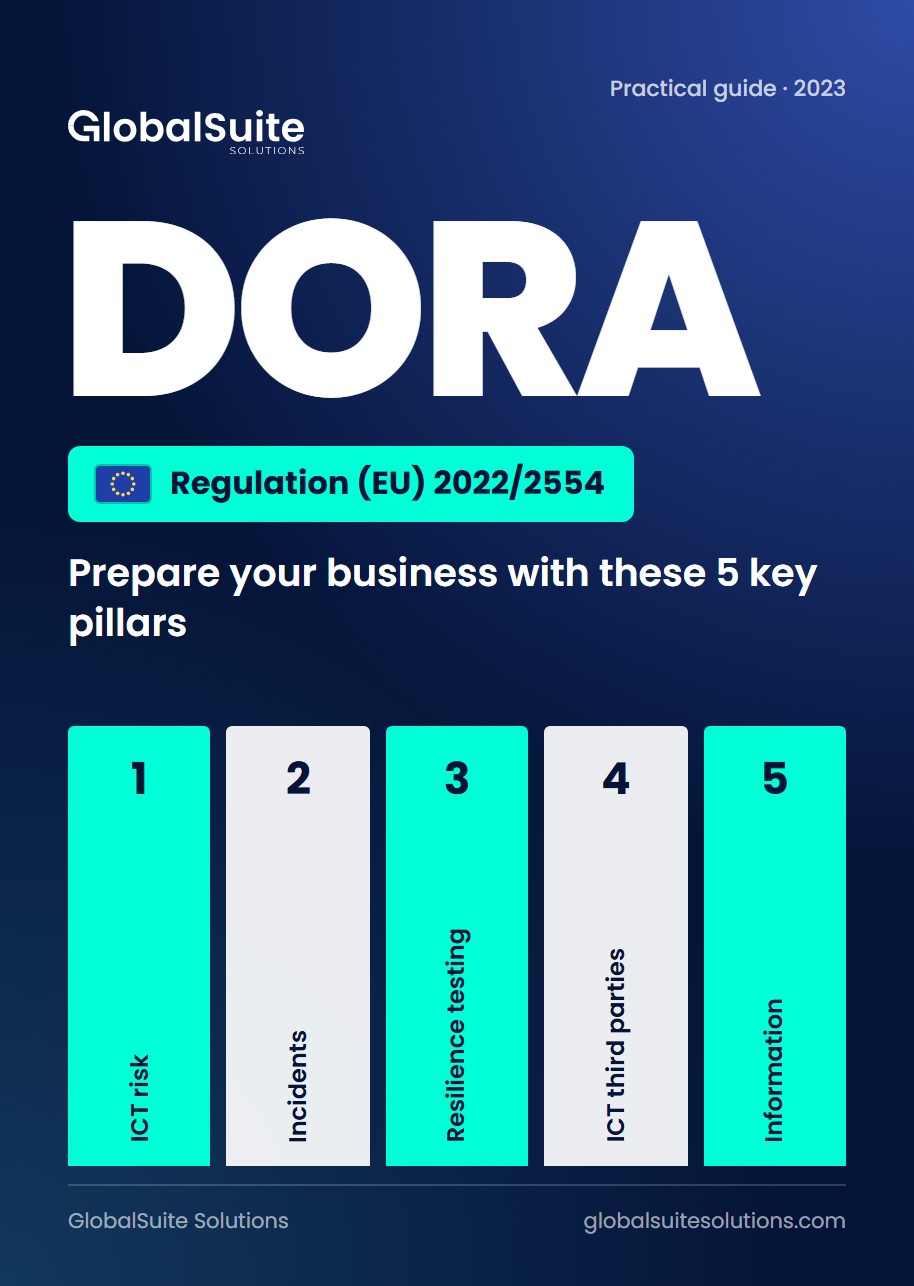
What DORA is, its key pillars and an action checklist.
Download the guide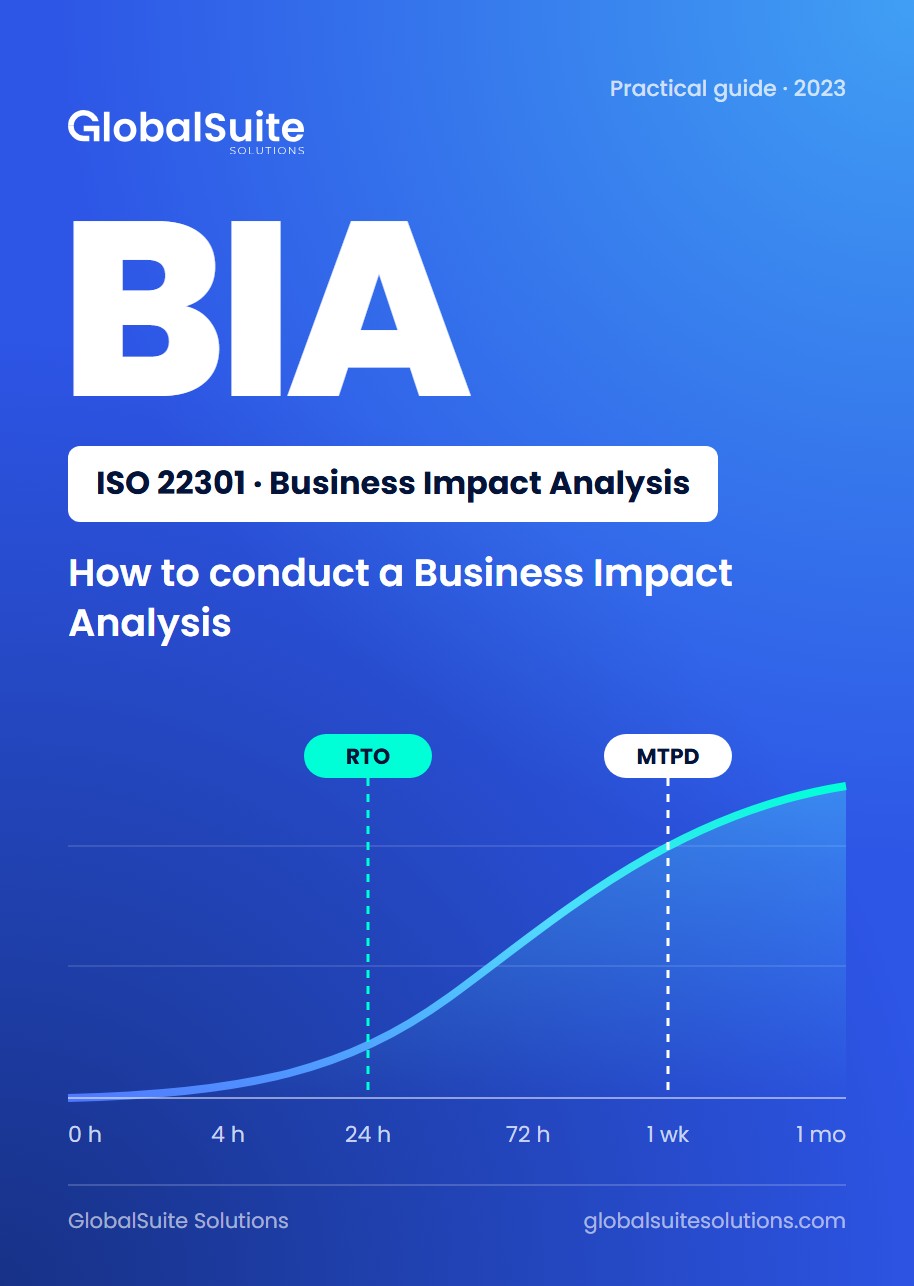
The steps to run a BIA and feed its results into your continuity plan.
Download the guide